
Samy Mansour
Partner •
Sydney

The latest quarterly report on foreign investment in Australia from the Treasury was released in February 2024 for the period 1 July 2023 to 30 September 2023 (Q1 2023/24).
Looking at the FIRB data for the last two (and a bit) financial years up to September 2023:
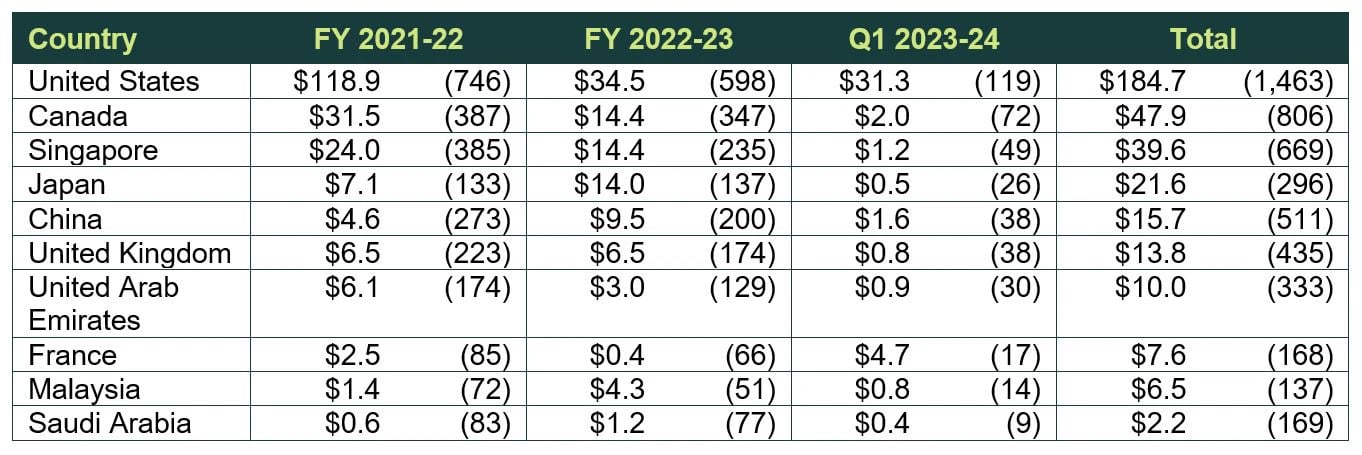
The United States was the top source of commercial investments into Australia for Q1 ($31.3 billion), followed by day light and then France ($4.7 billion). Rounding out the top five countries for Q1 2023/24 were Canada ($2.0 billion) followed by China ($1.6 billion) and Singapore ($1.2 billion). The total value of commercial investment proposals in Q1 2023/24 was up by over 40% to $49.5 billion ($34.9 billion in Q4 2022/23), quarter to quarter.
The surprise from this recent data is the increase in investment into Australia by French entities. Meanwhile, the United States continues to be the largest direct financial investor into Australia by a substantial margin.
In relation to investments into residential real property, for Q1 2023/24, China ($0.7 billion) was the top source. The other countries investing in Australian residential real property in Q1 2023/24 were Hong Kong, Vietnam, India, Taiwan, Nepal and the United Kingdom, all at $0.1 billion.
As identified in the table below, over the last two (and a bit) financial years, the United States is clearly the source of investment funds into commercial investments in Australia. The top five countries over that period include Canada, Singapore, Japan and China (in that order).
The table below identifies the top 10 countries investing into Australia over the last two financial years combined with Q1 2023/24:
Value $billion (number)
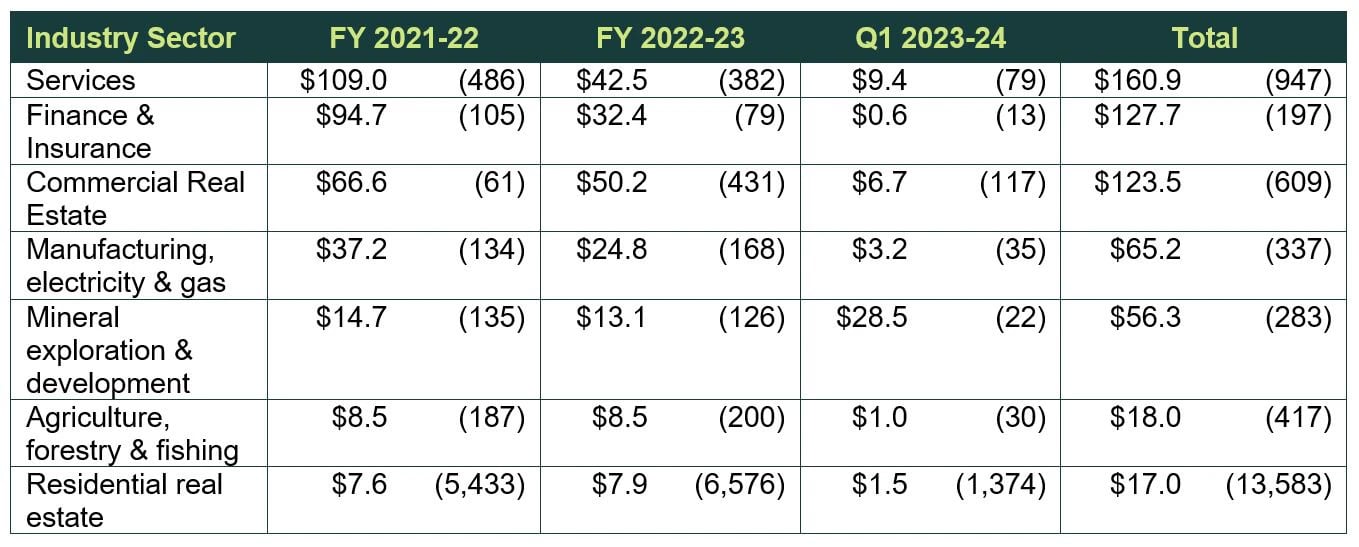
Reflecting a change from the preceding quarter, mineral exploration & development ($28.5 billion) was the most popular industry sector by value in Q1, by a substantial margin. Services and commercial real estate (in that order) were the most popular industry sectors in Q4 2022/23. For Q1, services was second ($9.4 billion) and commercial real estate was third ($6.7 billion) and manufacturing, electricity & gas ($3.2 billion). These last three mentioned industry sectors all experienced less investment (by value) when compared with Q4 2022/23.
As identified in the table below, over the last two (and a bit) financial years, the services industry sector is clearly the sector which attracts the larger portion of investment funds in Australia. The top five industry sectors over that period were commercial real estate, manufacturing, electricity & gas, finance & insurance, and mineral exploration & development (in that order).
The table below identifies the investment into the 7 industry sectors over the last two financial years combined with Q1 2023/24:
Value $billion (number)
Of the 283 approved commercial investment proposals for Q1, 108 were approved with conditions and 175 were approved without conditions. By monetary value, approximately 82% of these investment approvals had conditions imposed on them for the quarter ($40.8 billion out of $49.5 billion). This is roughly consistent with recent prior quarters.
Ninety-eight commercial investment proposals were withdrawn in Q1 (representing approximately 34.6% of approved applications). This is a significant uptick compared to Q4 (13.8%) and FY2022-23 (11.3%).
This material increase calls into question the actual processing time data set out below.
For Q1, of the 283 approved commercial foreign investment proposals, 13 applications related to national security actions (10 mandatory and three voluntary). This is a decrease in the number of national security applications as in Q4 2022/23 (24 out of a total of 297).
In Q1, 37 days was the median processing time for approved commercial investment proposals. This was a slight increase from the median processing time of 36 days in Q4 2022/23, but a decrease from the median of 52 days in 2021-2022 and 41 days in 2022-2023. Seventy five percent of approvals were considered in less than 60 days, including 40% in 30 or less days.
There is evidence that Treasury is continuing to refine its processes, and on the whole, becoming more efficient. However, this conclusion needs to be cautioned against the material increase in withdrawn applications as mentioned above.
The next quarterly report will likely be published in May 2024.
If you would like to know more about how your foreign investment application could be affected by these trends, please contact us.